Our Strategies Portfolio
Now, let us turn directly to the trading strategies which constitute the basis of my methodology. I will not go deep into details and describe the rules for opening and closing positions of each of my strategies because it’s going to take a lot of time and it’s not the purpose of this article.
So, the first strategy is a long-term strategy or LTS for short, which is also called «Envelope Strategy» . This trading strategy uses the following analytical tools:
1. First of all, this strategy uses one indicator called “Envelope”, it is build on a weekly chart and has two parameters which we will discuss later.
2. The additional tool of this strategy is the index of Average Daily Volatility or ADV for short. I define the volatility of the instrument using the daily chart, the parameter I use for calculation is 20 intervals.
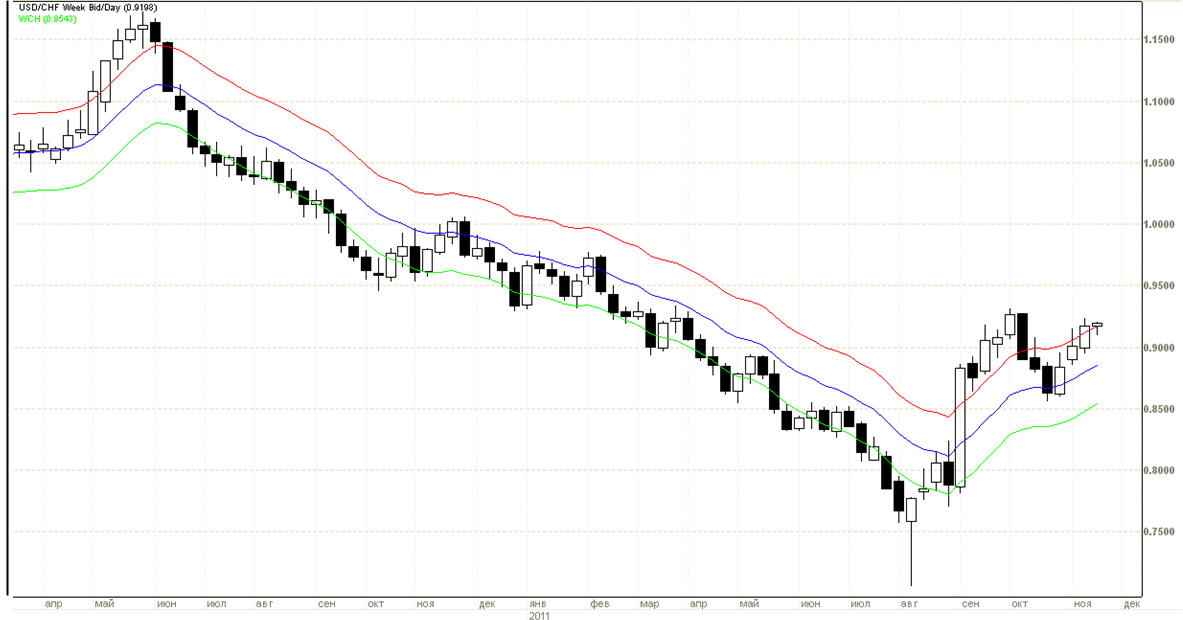
Here you can see how the strategy looks on the screen. We need to build only one price chart – weekly candlestick chart and apply a single indicator – an envelope consisting of three lines. The middle line of the indicator is an exponential type moving average, the parameter I use for calculation is 13 intervals or EMA (W) 13. Well, the upper and lower bands of the envelope are built at a distance of 2ADV from the central line. That’s it – everything you need to work using this strategy is in front of you on the screen.
What kind of signals are used in this strategy? The main signal that envelope indicator generates is when the price bar breaks through the top or bottom lines of this indicator. When for example, the price of the financial instrument breaks below the lower band of the envelope and the closing price of the weekly candle stays outside the envelope, it is very likely that a new one-way downward movement or downtrend starts to develop at this point. Our task is to use certain rules for opening and maintaining a position to join this trend and squeeze the maximum profit from it.
As I mentioned above, this is a long term strategy. The aim of this strategy is to profit from the long-term market price movements. Trading in accordance with the rules of this strategy, on average, will get you about 4-6 transactions on each financial instrument during one year. If it turns out to be that you got into the trend movement, the position may remain open for a few weeks or even months.
The second strategy is a medium-term strategy or MTS for short, which is also called “Multi-time frame strategy” or «MTFS». This trading strategy uses the following analytical tools:
1. First of all, the main instruments of the strategy are three pairs of moving averages, simple and exponential type, with a parameter of 200 intervals, built on three different timeframes.
2.The additional tool of this strategy is the index of Average Daily Volatility.
This strategy uses three timeframes: 4H, 1H and 10m.
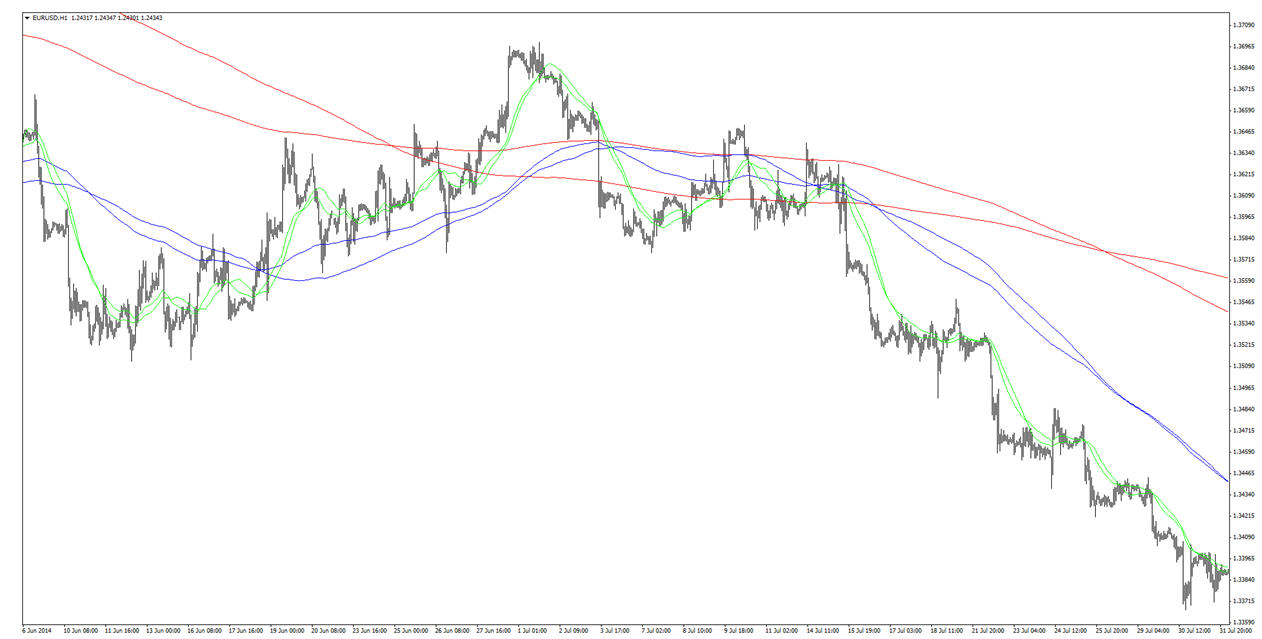
Here you can see how the strategy looks on the screen. All we need here is 1H price chart and three pairs of moving averages. Red lines are based on 4H chart, blue lines are based on 1H chart, green line is based on 10m chart. It is necessary to note here one important point. In this example, I use the MT4 platform. In order to build several moving averages with the same parameter of 200 intervals for the different timeframes in the same window, we should bring all moving averages’ parameters to a common standard. In other words, the number of time intervals for the moving averages on all timeframes should be recalculated in accordance with the parameters of the 1H timeframe.
So, after building all necessary indicators in the same chart window, we will be able to see the actions of the three groups of market participants: the pressure of long-term players is presented with the red lines; the actions of medium-term players are presented with the blue lines and the steps of short-term players are presented with the green lines. Based on the mutual disposition of the three pairs of moving averages and local highs and local lows formed during fluctuations in price, we can conclude which group of market participants is the strongest and what direction we should open positions.
As I mentioned above, this is a medium-term strategy. The aim of this strategy is to profit from the medium-term market movements what can last several days. Trading in accordance with the rules of this strategy, on average, will get you about 3-5 transactions on each financial instrument within one month. If it turns out to be that you got into the trend movement, the position may remain open for 2-3 days on average.
Finally, as for the short-term strategy or STS for short (short term strategy), I would like to note here that this is one of the oldest of my strategies, I developed and tested it for the first time in 2002. This strategy is also called «Double Barrel». This strategy has only 1 timeframe: 10m chart. It uses the following analytical tools:
1. First of all, it uses a pair of moving averages, simple and exponential type, with the parameter of 200 intervals built on 10m timeframe.
2. The third moving average is 10 times shorter than the previous two, it is exponential type MA.
3. As well as in the first two strategies, the additional tool of this strategy is the index of average daily volatility.
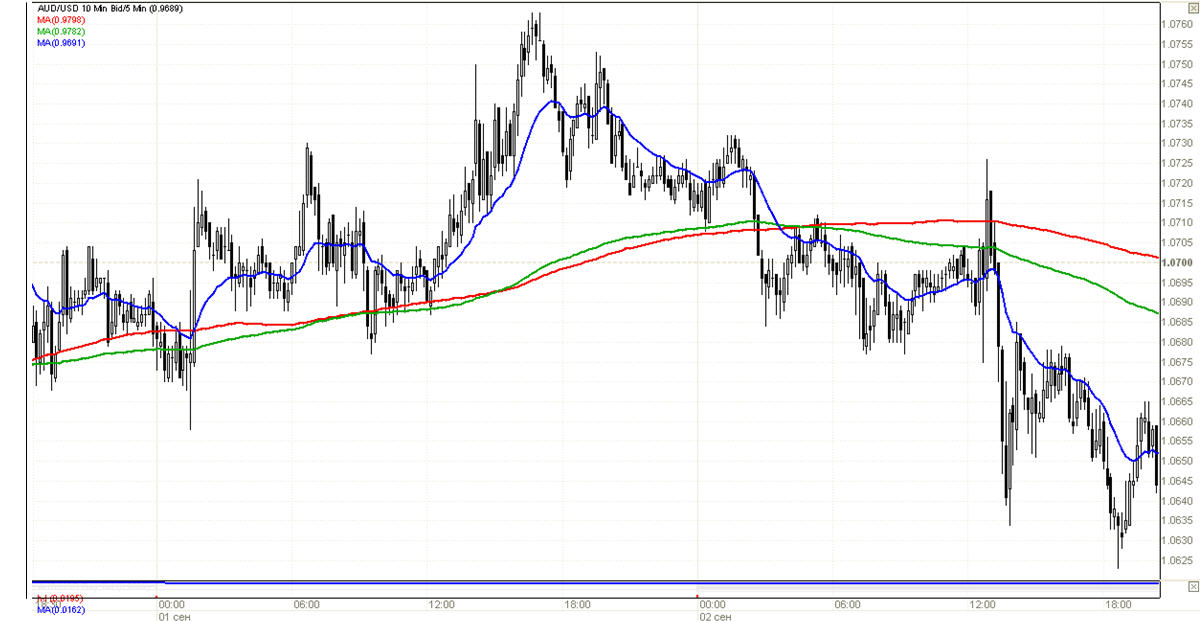
Here is the strategy on the screen: a pair of long moving averages with the parameter of 200 intervals – red and green and one short moving average with the parameter of 20 intervals – blue. The intersections of a pair of long-term averages and one short-term average and their convergences and divergences generate the trading signals of this strategy.
The aim of this strategy is to profit from short-term market movements that can last from a few minutes to several hours. Trading in accordance with the rules of this strategy, on average will get you about 5-10 transactions for each financial instrument within one month. Most of the transactions of this strategy are opened and closed within one trading day.