Technical Profile of the Instrument
“Technical Profile” of a financial instrument is quite a handy and useful tool for any trader. No matter what style of trading you prefer, be it short-term, medium-term or long-term – if you can see the full picture reflecting the price dynamics of a financial instrument on different timeframes, you can more effectively manage an open position or a portfolio consisting of several positions, use techniques of hedging positions, timely increase or decrease your presence in the market. The “Technical Profile” of the instrument allows you to do this.
First of all, the “Technical Profile” of a financial instrument contains information about all formal and actual positions opened according to the rules of proprietary trading strategies, present in the trader’s portfolio. It also contains target levels for profit taking (TP), loss limitation levels (SL), key resistance and support levels on daily charts, volatility parameter of the instrument, statistics on trading signals and some other information. It can be said that “Technical Profile” reflects all the most important information on a financial instrument from the point of view of technical analysis.
In the diagram below you can see the “Technical Profile” of one of the financial instruments – the currency pair USDJPY.
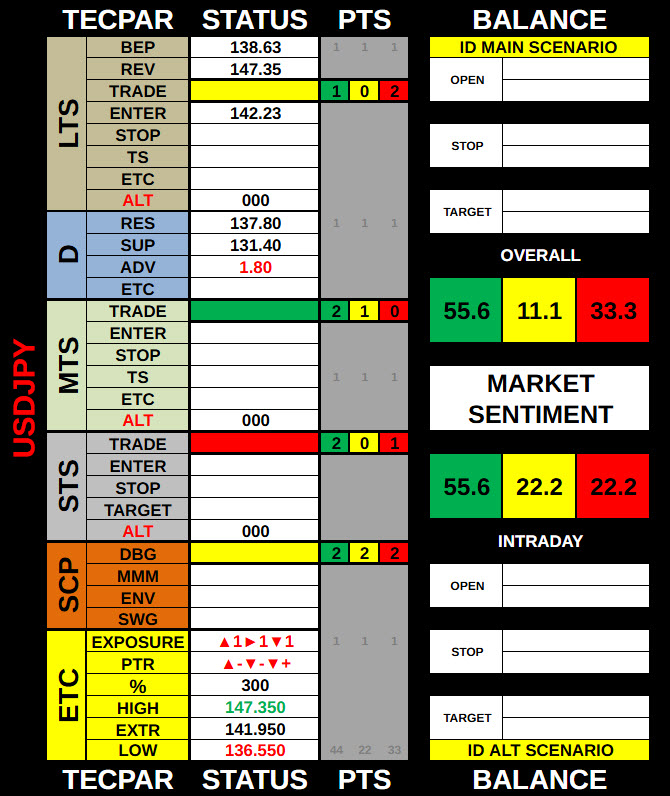
“Technical Profile” is divided into sectors, which reflect the technical picture of the financial instrument from the point of view of one or another proprietary strategy. As you can see, there are sectors LTS, MTS, STS, corresponding to long-term, medium-term and short-term strategies. There is also sector D, which corresponds to the daily time frame; sector SCP, which corresponds to the scalper strategy, and sector ETC (which indicates other parameters of the financial instrument).
In the STATUS column, in the corresponding cells of the table, the parameters of the current position in the financial instrument within the framework of the corresponding strategy are indicated. Here you can see the position direction (red color – Short Position or SHORT ▼ / green color – Long Position or LONG ▲ / yellow color – no open positions or NO EXPOSURE ►), position opening point (ENTER), initial loss limitation level (STOP) and trailing stop level (TS).
In the appropriate cells of the PTS (Points) column is indicated the balance of power of market participants within the selected trading strategy on a three-point scale basis (Bulls – in green, Bears – in red and Neutrals in – yellow color). Moreover, it should be noted, that the number of points corresponds to the bullish, bearish or neutral sentiment towards the base currency or asset.
Finally, summing up the scores within all trading strategies, the overall balance of power in the selected instrument can be calculated as a percentage. This information is indicated in the rightmost column of the “Technical Profile” of the financial instrument – BALANCE.
Also, a separate column of this table contains information on market exposure, i.e. availability of formal and actual positions for the selected financial instrument (EXPOSURE). For example, the value “▲2►1▼0” indicates that there are 2 long positions (LONG▲), one neutral position (NO EXPOSURE►), and no short positions (SHORT▼) for the selected instrument according to the rules of all trading strategies in the portfolio.
The abbreviation PTR at the bottom of this table shows the direction (LONG▲ or SHORT▼) and results of previous trades (+ or -) and corresponds to PRIOR TRADE RESULT. For example, the value “▲-▼-▼+” indicates that the previous trade of a long-term strategy (LTS) was LONG▲ and closed with a negative result (SL), the previous trade of a medium-term strategy (MTS) was SHORT▼ and also closed with a negative result (SL), and finally, the previous trade of a short-term strategy was SHORT▼ and closed with a positive result (TP). From a statistical point of view, the chances of a positive trade outcome are slightly higher after a losing trade, especially if this is confirmed by the results of testing the strategy on historical data.
No doubt, you might have a question, how to use all of this information in real trading and what it gives to a trader?
Talking about the practical value of the “Technical Profile” of the financial instrument, the most important point, that I would like to mention, is as follows – when trading on different timeframes according to the rules of different trading strategies, it is useful to see what is happening on a larger and a smaller timeframes of the selected financial instrument. If there is a confluence of signals generated by different trading strategies on different timeframes, then the probability of movement in the direction indicated by the signal in the selected timeframe increases.
For me, it’s quite obvious, that this information can be used as a trend indicator for those traders who like intraday trading. If you know the current level of ADV (average daily volatility) and the balance of power of market participants within the selected instrument, then this piece of information gives you an opportunity to evaluate the possibility of different trading scenarios during the trading day. Because of this reason, the Technical Profile of the instrument provides you with space for indicating the main and alternative scenarios for the upcoming trading day in the far right column. At last, the snapshot of the Technical Profile of the financial instrument taken before and after your trade can be a key element of your trading log.
GMT Partner offers its customers a subscription plan to the Technical Profile of a number of financial instruments. This service is a “must” for active traders and investors. To subscribe to the Technical Profile of the financial instruments that you trade, please send your request here or make your order here.
DISCLAIMER:
The risk of loss in trading Forex, futures, stocks and options can be substantial and is not suitable for all investors. Past performance is not necessarily indicative of future results. GMT Partner Ltd only provides educational services. By accessing any GMT Partner Ltd content, you agree to be bound by the terms of service. Testimonials are believed to be true based on the representations of the persons providing the testimonials, but facts stated in testimonials have not been independently audited or verified. Nor has there been any attempt to determine whether any testimonials are representative of the experiences of all persons using the methods described herein or to compare the experiences of the persons giving the testimonials after the testimonials were given. The average reader should not necessarily expect the same or similar results. Past performance is not necessarily indicative of future results. No person was compensated for providing a testimonial.